
 EVOLUTIONARY TREES will show up fairly frequently here, and are also frequently misunderstood, so I will present a summary of Gregory’s excellent article “Understanding Evolutionary Trees“. I strongly suggest reading it (free full text!) because while I have shown a few of his cladograms he has many more in the paper and goes into much more detail regarding common misunderstandings about evolutionary trees. Some of these misunderstandings are related to the way we tend to think about evolution, some are due to unfamiliarity, and others are learned from obsolete presentations of the process of evolution. Even people who are familiar with evolution may need to pause once in a while and think “Is that a correct interpretation?” when looking at evolutionary trees.
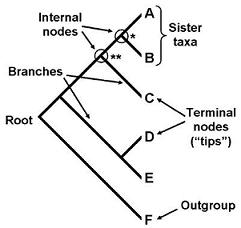 This is a generalized cladogram. The nodes represent divergences or speciation events. At the node with a single asterisk organisms A and B share a common ancestor, and at the node with two asterisks A, B, and C share a common ancestor. The outgroup is a group distantly related to all, and roots the tree at a common ancestor shared by all organisms on the cladogram. While simple in appearance, cladograms are not always easy to understand. There are ten common mistakes people make when reading a cladogram.
- Higher and Lower: In the past evolution was misunderstood as a teleological process that is driving towards some goal, like complexity or higher intelligence. People sometimes still speak of certain organisms being “more evolved” than others. Since we have a common ancestor about 3.8 billion years ago, every organism on earth is just as evolved as every single other living organism. Organism A on the cladogram above is not “higher” or “more evolved” than organism F.
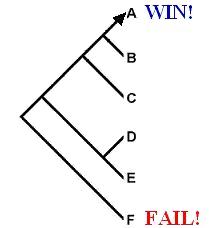 Main Lines and Side Tracks: This is related in a way to the first mistake, but is more subtle. This is a perception that the evolutionary tree culminates with the organism farthest away from the outgroup, with the other positions on the tree being sidetracks on the way to this goal. It is aggravated by a tendency of scientists drawing cladograms to put groups we tend to favor farthest away from the outgroup, like placing humans or mammals in position A. I refer to this misunderstanding as “win vs. fail” (adapted from Gregory’s cladogram).
- Reading Across the Tips: This is a mistake that comes from looking at the tips of the cladogram rather than the nodes. Looking at the first cladogram, a person might be mistaken in thinking that D is more closely related to C than E is since the tips are ordered with D next to C. However, counting up the nodes (common ancestors) from the base of the tree shows the D and E both share two common ancestors with C and are thus equally closely related. Reading across the tips can also mislead a person into thinking an evolutionary trend is present if there seems to be a pattern of characters at the tips, even though that pattern might not show up sequentially at the nodes at all.
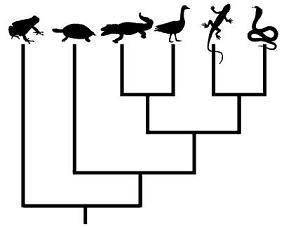
- Similarity vs. Relatedness: This is mostly a mistake of amateur taxonomy (most people class hyenas in with dogs while they are more closely related to cats), but can result in misreading of cladograms. Some groups are closely related but dissimilar in appearance. This cladogram shows the extant sauropsids. Notice that birds are more closely related to crocodilians
- Sibling vs. Ancestor: Sometimes a group is mistaken as being descended from its sister group instead of the two sharing a common ancestor. For instance, a person might think that birds are descended from crocodilians. In actuality neither crocodilians nor birds are descended from the other, but both are descended from a common ancestor at the node. In some cases this common ancestor may be quite different than either of the sister groups that are its descendants.
- Long Branch Implies No Change: This is another one that I sometimes slip into. This most often is applied to the outgroup, especially when the outgroup is not a popular favorite. For instance, if the outgroup is the sponges a person might misinterpret the tree to mean that since the divergence of the sponges and the other groups on the cladogram, sponges have not changed a whit. True,
- Different Lineage Ages for Modern Species: We know some groups appeared before others and think of them as older, and might think this means that they have had more time to evolve. While sponges first appeared before humans did, genes in the line leading to modern sponges and the line leading to modern humans have been evolving for just as long. Every extant species is just as evolved as every other extant species.
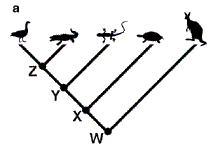
- Backwards Time Axes: From surveying students it was discovered that sometimes people will read the axis of time going across a cladogram from left to right, or from the left-most tip to the root. In this cladogram a student might read birds as the oldest group across to kangaroos as the most recent. This is, of course, completely wrong. Time flows
- More Intervening Nodes Equals More Distantly Related: It is easy to see how a person could make this mistake. Rather than counting nodes, to determine relatedness count the number of common ancestors starting at the root of the tree. On the cladogram above a person might think that birds and mammals are more distantly related than turtles and mammals because to reach mammals from birds you count back four nodes, while reaching mammals from turtles only requires counting back two. But if you start at the root of the tree and count up common ancestors, both turtles and birds have the same number of common ancestors with mammals, one at the root of the tree (node W). In the same way people might think that lizards are more closely related to turtles than birds are, because you count back two nodes to reach turtles from lizards while you count back three to reach turtles from birds. But lizards and birds both share two common ancestors with turtles, one at W and one at X, so they are equally related. (This is assuming turtles are properly placed among the anapsids, if they are really derived diapsids this tree may change in future!)
- Change Only At Nodes: In future posts I expect to be talking about the pattern of character acquisition in evolutionary history. It seems intuitive to recognize changes occur at nodes, but changes can also occur along branches. This is because a branch collapses together the evolution of various lineages for the sake of brevity and because we do not have an exhaustive record of every species that ever existed (that cladogram would be densely packed!) Examining the echinoderm cladogram, it is obvious that the branch leading to the outgroup (humans) is in reality an entire tree of its own. Towards the base of that branch are basal deuterostomes, and then many different characters were acquired along that branch before humans evolved. Additionally, humans were chosen arbitrarily to represent the chordates, in actuality every single other chordate extant and extinct would also fall on that tree.
than any other reptiles. Based on appearance most people would probably think crocodilians are most closely related to lizards and would not place the birds among the reptiles at all. Both choices would be wrong. Here also a person might read across the tips to think that crocodilians are more closely related to turtles than they are to birds, since crocodilians and turtles are adjacent and more grossly similar than are crocodilians and birds.
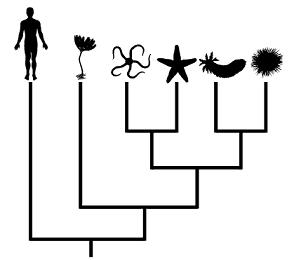
sponges have not changed much in appearance since they first evolved, but they have certainly changed genetically. Sponges did not freeze their genomes after the divergence of other living creatures, providing us with an unchanged ancestral genome. In order to get that, we would need a time machine. Even when there is no obvious physical change, there is much genetic change. One way of turning the tables and correcting this notion is to use favored groups as the outgroups, as in this echinoderm cladogram. Certainly no one will think that when the deuterostomes diverged humans were there in their present form!
from the root through all of the branches to the tips, but most cladograms are not designed to show the specific timing of events. This cladogram, for instance, does not show when any of the groups shown first appeared.
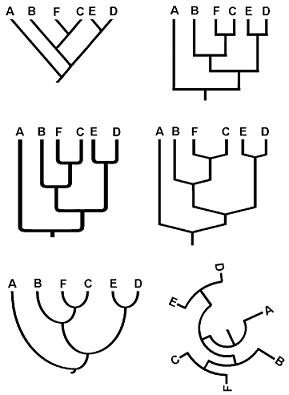 Now that I have given an overview of the errors Gregory points out, there are two simple ways to help correct most of them. In my opinion the easiest way is to move away from the first type of cladogram. I think the first cladogram tends to mislead people into thinking of evolution as a linear process with side-tracks (win vs. fail!) and makes reading across the tips easier to slip into. Any of the four bracketed branching patterns seems less misleading to me, perhaps just due to the removal of an appearance of linearity (it’s less tempting to put arrowheads at those tips!) The last version has its uses but should probably be restricted to those already very familiar with evolutionary trees.
The second simple fix is to move away from placing favored groups at the top or far right of a cladogram. This can be done sometimes by substituting a less high-profile member of that group. Rather than using humans to represent mammals, use mice (or platypii, assuming that won’t confuse your audience!) An even better way is to simply rotate the nodes to place the favored group in the interior of the cladogram.
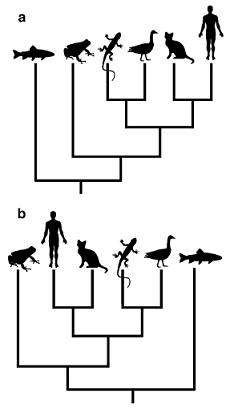 I like example b because it does not use straight lines, but rectangular forks, it places the outgroup on the right, where we would usually place the “most evolved” group, and it rotates the nodes to shift the favorite group, humans, to the interior of the diagram. This makes many common errors much less likely to crop up. The cladogram is less likely to be interpreted as showing a culmination in humans, a time axis progressing left to right, a pattern of character acquisition across the tips not represented in the nodes, and a sister relationship between tips (lizards and frogs, for instance) due to gross similarity and visual proximity. Additionally, I find it much easier to count common ancestors on a rectangular forked tree. If it is the case that cladograms with rectangular forks are generally easier to read, this would be a good reason to shift away from laddered cladograms like the generalized one given, or at least to frequently rotate around internal nodes to help remove the appearance of linearity.
Gregory, T. (2008). Understanding Evolutionary Trees. Evolution: Education and Outreach, 1(2), 121-137.

21 comments
Comments feed for this article
March 16, 2008 at 7:31 am
TR Gregory
And rotate nodes mentally whenever you see a tree!
March 16, 2008 at 7:53 am
Blogrolling « The Limonit Blog
[…] of the Day – Ig or Sed Explained Keep your impacts out of our deglaciation! Chondrite normalization Understanding Evolutionary Trees The Diet of Saber-Toothed Cats The Great Warming – and I missed it Death Valley Fans Responding to […]
March 16, 2008 at 8:44 am
nunatak
This post strikes me as a really useful teaching tool. Thanks! Here’s another helpful tip someone gave me a couple years ago: imagine that the nodes are really ball bearings and then mentally “spin” all of the branches around their nodes. Another way to visualise this is to imagine holding the tree upside down by the root and pretending it’s a mobile. All the nodes can spin, and yet the actual topology of the tree never changes, nor does its meaning. In fact, building such a mobile for use in classrooms might work wonders.
March 16, 2008 at 10:50 am
archaeozoo
This was a really clear introduction to a potentially complicated topic.
March 16, 2008 at 5:16 pm
Sphaerula » Understanding Evolutionary Trees
[…] posted a summary, which was graciously acknowledged today by Dr. Gregory, and that was how I learned about the […]
March 16, 2008 at 7:04 pm
Don
In #5, you said:
“Sometimes a group is mistaken as being descended from its sister group instead of the two sharing a common ancestor.”
As far as the cladogram, these would be the same. Correct?
March 17, 2008 at 8:42 am
Nimravid
“As far as the cladogram, these would be the same. Correct?”
Yes, in that birds and dinosaurs share a common ancestor and are sister groups, although birds’ ultimate origin is within the dinosaurs. Yet only one dinosaur species was the one that led to the birds, so the majority of the dinosaurs at the split are sisters, not parents. Cladograms usually are used with groups at a higher level than species, so a branching pattern is appropriate even when a group is nested within another since all but one species of the parent group are sisters.
I’m not sure that we know with much certainty any species as the direct parent of another. This being an unusual situation, I haven’t really thought about how it would be depicted on a cladogram at the species level. If it were a case of gradual transformation of one species into another, the parent species would run along a branch and there would be no fork. If they did diverge and both survived, they would probably be placed as sister groups when in fact one is a daughter group.
Usually the danger is not placing species as sisters when one is parent, but placing one as parent when they are sisters. For instance, humans and chimpanzees are sisters, but there are an awful lot of people who think that humans descended from chimpanzees.
March 17, 2008 at 8:08 pm
Don
Thanks for the clarification…
Another simplifying assumption when constructing trees is to make the focus explaining where our current species come from. For this reason, a legitimate branch that has terminated in the past will be dropped off the tree. A casual observer will think there was a “straight line” transformation from one species to another – more justification for the Transformationalists.
March 20, 2008 at 7:40 am
Schizodoxe | le blog des mutations : sciences, technologie, robotique, culture, video, news, infos, analyses...
[…] Source : Nimravid’s Weblog. […]
March 20, 2008 at 9:55 pm
Mike White
Great post – what would you think about writing stuff like this for Scientific Blogging, where Ryan Gregory is a featured writer? We’ve got a fairly sizeable readership over there that would be interested in the things you write about.
If you’re interested, send me an email (in my commenter info). I’m Mike, the author of the blog Adaptive Complexity.
March 21, 2008 at 10:33 am
The Cambrian Explosion and the Appearance of Phyla « Nimravid’s Weblog
[…] back to my post on the article “Understanding Evolutionary Trees”, two common mistakes in analyzing evolutionary trees are assuming no change along a branch and […]
April 9, 2008 at 4:21 pm
Sorry So Slow « Nimravid’s Weblog
[…] quiz is a good example of some of the tendencies that we have that I mentioned in my entry on understanding evolutionary trees. Appearances can be deceptive–if we get tricked into thinking of evolution as a linear […]
April 11, 2008 at 6:00 pm
Howard C. Shaw III
I have to take issue with your comments about all species being equally evolved. While I understand where this is coming from, and I understand the frustration with those who see man as a ‘higher’ being, I would like to point out what I see as a critical flaw.
It is certainly true to say that all known species have had an equal time to evolve . . . I do not think it is true that all species are equally evolved. If evolution occurs by natural selection, and natural selection operates by differential reproduction, then the pace of evolution seems to me to be clearly tied to the generation length – the period of time from inception to reproduction.
To be specific, E. coli has a generation length of about twenty minutes, a particular study area of Asian elephants, a period of eighteen years. Eighteen years is about 9,467,078 minutes, or about 473,354 E. coli generations.
Furthermore, the rate of natural selection for a species, given that the mechanism is differential reproduction, must be tied to the available population, and while neither may be known precisely, there is clearly a difference of many orders of magnitude between their relative populations.
In my opinion, it is not unreasonable, then, to claim that any species of bacterium has been through many orders of magnitude more selective events than any species of multi-cellular eukaryote, and especially of any mammalian species.
If a species has experienced more selective events than another, why would it not be appropriate to say it is more evolved than another? Aside, of course, from the expressions of disgust on people’s faces when they read that bacteria are more evolved than they?
Alternatively, one may take a functional view of the term ‘evolved’ as it is applied in a relative sense. In this case, the measure of how ‘evolved’ something is might be equated to how ‘adapted’ it is for the environmental niche it occupies, which would translate to taking the prior discussed measure, and adding a multiplicative time factor, of how long the species has been in that niche, plus some additional measure of how initially well it fit its new niche.
In that case as well, it is probable that most bacterium would qualify as more well-adapted, and thus, more evolved, than most mammals.
April 24, 2008 at 4:31 pm
T Rex is a big chicken « Bruises Colours
[…] read this part, and I think about this wonderful post I read a while ago explaining how to read an evolutionary tree. So if I understand all that right, I would guess that chickens are not descendant from the T […]
May 9, 2008 at 9:20 am
Who are you calling ‘primitive’? « Nimravid’s Weblog
[…] Ryan Gregory at Genomicron has written about misunderstandings of phylogenetic trees and the evolutionary process even among scientists, and thinks that these misunderstandings are […]
April 25, 2011 at 7:31 am
Kate
Thank god for this website. I could not understand how to interpret the relatedness of species. I was counting nodes but now I know to count common ancestors. Saved my bio grade!
June 21, 2012 at 2:59 am
Anonymous
This website was exactly what I needed to give me a better understanding about evolutionary trees.
March 27, 2013 at 7:45 am
namesake
An excellent explanaition…. great job!
July 23, 2013 at 1:02 pm
https://mdeawards.com
Hi everyone, it’s my first go to see at this site, and paragraph is truly fruitful in favor of me, keep up posting such articles or reviews.
August 17, 2016 at 1:21 am
Emerging Infectious Disease: What Is Elizabethkingia? | American Council on Science and Health
[…] *For more on how to read a phylogenetic tree, see here, here, and here. […]
September 18, 2017 at 2:57 am
Basic Concepts: Biology – Evolving Thoughts
[…] Understanding evolutionary trees by Nimravid at Nimravid’s Weblog […]